
Van Westendorp Price Sensitivity Meter: What Do Its Four Price Points Actually Tell You?
The Van Westendorp Price Sensitivity Meter is usually explained through four survey questions, four cumulative curves, and four intersection points. Those intersections are assigned names such as the Optimal Price Point, Indifference Price Point, and Range of Acceptable Prices.
This conventional organization explains how the method works. It does not necessarily explain what the results establish.
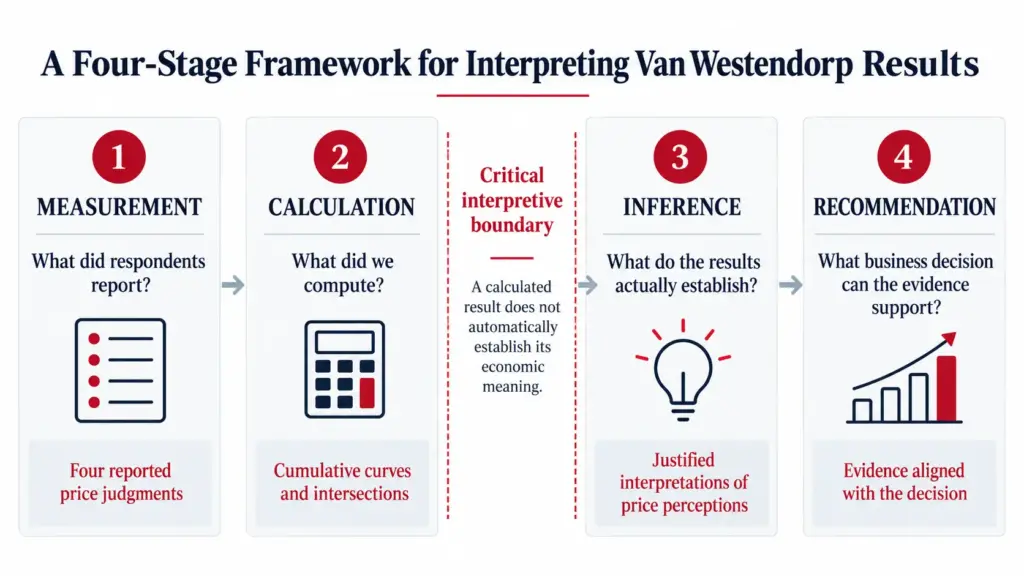
A more useful framework distinguishes four stages of pricing evidence: measurement, calculation, inference, and recommendation.
This distinction matters because the information collected from respondents is not the same as the mathematics applied to their answers. Neither automatically establishes which price a business should charge.
From Four Price Points to Four Stages of Pricing Evidence
| Stage | The central question | Where the familiar Van Westendorp elements fit |
|---|---|---|
| 1. Measurement | What did respondents actually report? | Four price questions and reported thresholds |
| 2. Calculation | What mathematical operations were performed? | Cumulative curves, OPP, IPP, PMC, PME |
| 3. Inference | What do those calculations legitimately establish? | Price perceptions, apparent acceptability, price sensitivity interpretations |
| 4. Recommendation | What evidence supports a pricing action? | Applications, limitations, extensions, pricing decisions |
The four survey questions, four curves, and four intersections remain important. They are components of a larger chain of evidence, not competing ways of organizing the analysis. The distinction is consequential: knowing how an output was calculated is different from knowing what it establishes or which business decisions it can support.
Each stage has a different purpose. Moving from one stage to the next requires an interpretation, an assumption, additional evidence, or some combination of the three.
1. Measurement: What Did Respondents Actually Report?
Peter van Westendorp introduced the Price Sensitivity Meter in 1976. His original ESOMAR paper described the technique as a way to measure price perception, characterizing the approach as essentially psychometric.
The four familiar questions ask respondents to identify prices at which a product becomes:
- Too cheap: So inexpensive that its quality or credibility is questionable.
- Cheap or a bargain: An attractive price relative to the value offered.
- Expensive: A price that requires consideration but does not necessarily prevent purchase.
- Too expensive: A price beyond which the respondent says they would not consider purchasing.
These are useful questions. They reveal how respondents interpret prices and where they report important boundaries. But it is equally important to understand what respondents have not been asked to do. They have not been asked to choose among competing product offers or indicate their likelihood of purchasing at specified prices.
Although some questions refer to hypothetical purchasing behavior, respondents are reporting price thresholds rather than purchase probabilities at specified prices. Reported price judgments are not the same as measured purchase intentions or estimated price response. There is nothing inherently inadequate about collecting price judgments. They can provide valuable information about perceived quality, value, and price acceptability.
The problem arises when those judgments are interpreted as evidence of purchasing behavior that the study did not establish.
2. Calculation: How Do Price Judgments Become Price Points?
The conventional Van Westendorp analysis aggregates reported thresholds into cumulative distributions. Analysts then calculate intersections between those curves.
Four intersections receive particular attention.
| Conventional output | Mathematical definition |
|---|---|
| Optimal Price Point (OPP) | Intersection of too cheap and too expensive |
| Indifference Price Point (IPP) | Intersection of cheap and expensive |
| Point of Marginal Cheapness (PMC) | Intersection of too cheap and not cheap |
| Point of Marginal Expensiveness (PME) | Intersection of too expensive and not expensive |
The PMC and PME are commonly used to define the Range of Acceptable Prices.
There is a further complication: some implementations use alternative intersections to construct a narrower acceptable price range. The R package pricesensitivitymeter documents both conventions.
Consequently, two analysts can produce different acceptable price ranges from the same respondent data simply by applying different definitions. Neither calculation necessarily contains an arithmetic error.
The important distinction is that the intersection is a calculated property of the response distributions. Its economic interpretation is a separate matter.
3. Inference: When the Names Promise More Than the Mathematics Establishes
The names assigned to Van Westendorp’s outputs are more ambitious than their mathematical definitions. Terms such as optimal, indifference, and acceptable suggest economic conclusions that the underlying calculations do not establish.
The Optimal Price Point: What Does It Actually Optimize?
The OPP identifies the price at which equal proportions of respondents report the two extreme price objections: too cheap and too expensive.
Under the usual monotonicity assumptions, that crossing minimizes the larger of the two reported objection rates. That is a mathematical result. But it does not necessarily minimize the total objection rate, maximize sales, maximize revenue, or maximize profitability. Those are different objectives.
To identify a revenue-maximizing price, for example, we need information about how purchases respond to price. To identify a profit-maximizing price, we also need relevant cost information. The OPP calculation supplies neither directly.
The issue is not that the intersection is meaningless. It is that a balance between two reported perceptions should not be confused with an economically optimal selling price.
The Indifference Price Point: Indifferent Between What?
The IPP identifies the intersection of aggregate cheap and expensive perception curves.
It does not demonstrate that individual consumers are economically indifferent between alternatives, nor does it establish equal utility or equal purchase probabilities. The word indifference has a specific meaning in economic analysis. An equality between two aggregate reported-perception rates does not establish that meaning.
The Acceptable Price Range: Acceptable in What Sense?
The conventional acceptable price range identifies boundaries derived from aggregate distributions of reported price thresholds.
It does not mean that every price inside the range will produce adequate demand, or that prices outside it are commercially impossible. Nor does it establish the price at which customers will actually purchase. The range may nevertheless be useful for understanding how a target population perceives price positioning and where objections become prominent.
The interpretation should match the measurement.
4. Recommendation: What Evidence Is Needed to Choose a Price?
A company might need to determine a launch price, evaluate a price increase, compare competitive offers, or establish a credible premium position. Those decisions do not all require the same evidence.
Van Westendorp can contribute useful information when the research question concerns perceived price boundaries, expectations, or positioning. Decisions involving expected purchasing behavior generally require additional evidence connecting prices to choices or demand. Decisions about profitability also require costs, objectives, and business constraints.
The NMS extension adds purchase-intent measurements and assumptions to estimate purchase probabilities and revenue outcomes. Those additional measurements should not be confused with what the original four questions establish.
In my work designing and analyzing pricing and choice research, I treat the move from an analytical result to a business recommendation as a separate step. The question is whether the evidence actually supports the proposed pricing decision.
Why Alignment Across the Four Stages Matters
The Price Sensitivity Meter is often presented as a progression from four questions to four curves to four price points and ultimately to a pricing recommendation.
A more defensible progression is:
Measurement → Calculation → Inference → Recommendation
- Measurement establishes what respondents reported.
- Calculation describes how those observations were transformed.
- Inference determines what conclusions the analysis supports.
- Recommendation connects that evidence to a particular business decision.
The critical requirement is alignment across all four stages: the calculations must accurately represent the measurements, the inferences must be justified by those calculations, and the recommendations must be supported by the inferences and appropriate to the business decision.
Reported price perceptions can help companies understand customer expectations, potential positioning problems, and perceived price boundaries. They should not automatically be treated as estimates of price elasticity, competitive demand, or economically optimal prices.
The larger lesson applies well beyond Van Westendorp: a pricing method should be evaluated by the evidence it produces and the conclusions that evidence can support and not simply by the names of its outputs.
